
Visualisations
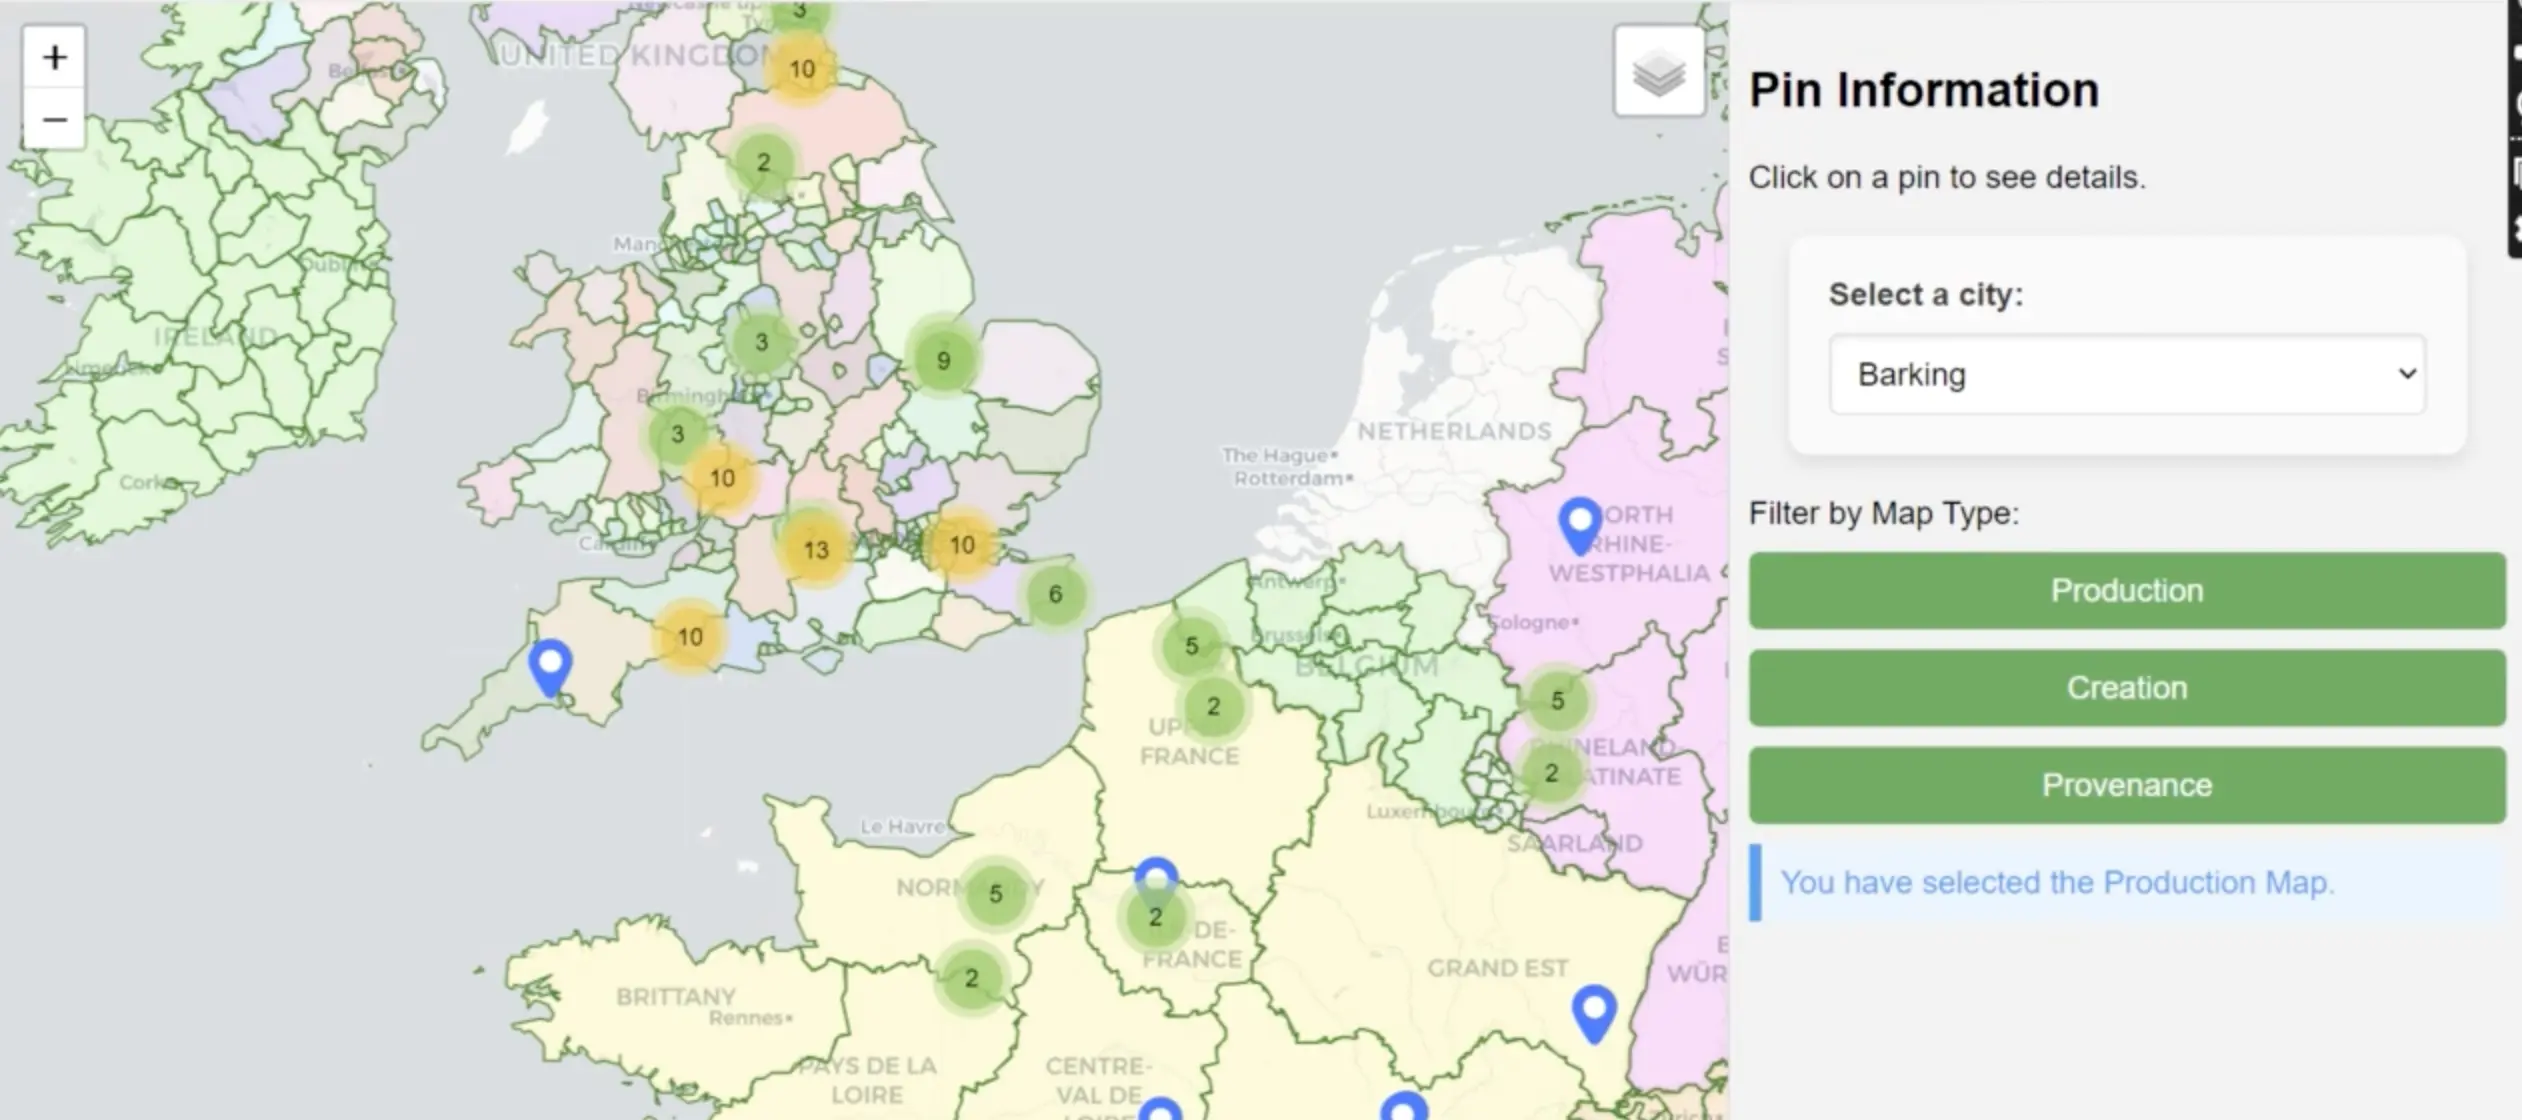
See visualisations built from the Searobend data, showing how much English survives from different subperiods, and when and where it was copied, as well as information about the total amount of data ingested in Searobend.
See visualisations built from the Searobend data, showing how much English survives from different subperiods, and when and where it was copied, as well as information about the total amount of data ingested in Searobend.